AI-translated from the Chinese original View original
Once both tubes lit up, the device had the appearance I wanted. Turning a pair of glowing digits into something I would glance at every day still required software. The original idea of putting AI to work on its own quota would only come together when the allowance on my computer actually appeared inside the tubes.
This article covers the firmware and desktop companion, including data sources, the meaning of a two-digit display, and how a small screen and one knob bring configuration and everyday use together.
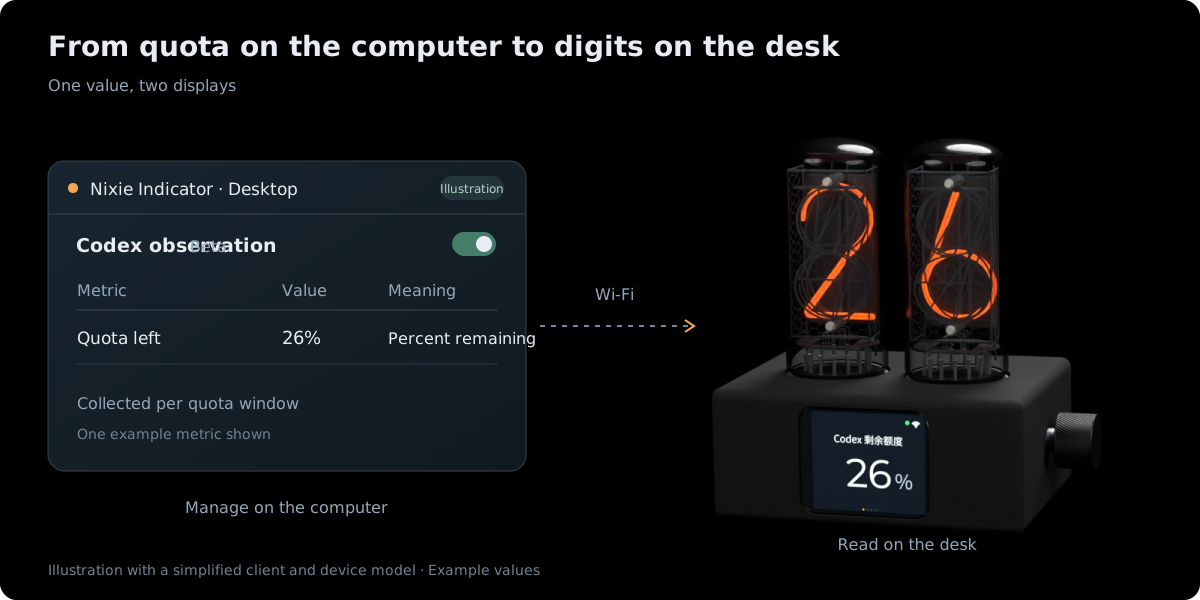
The Data Path
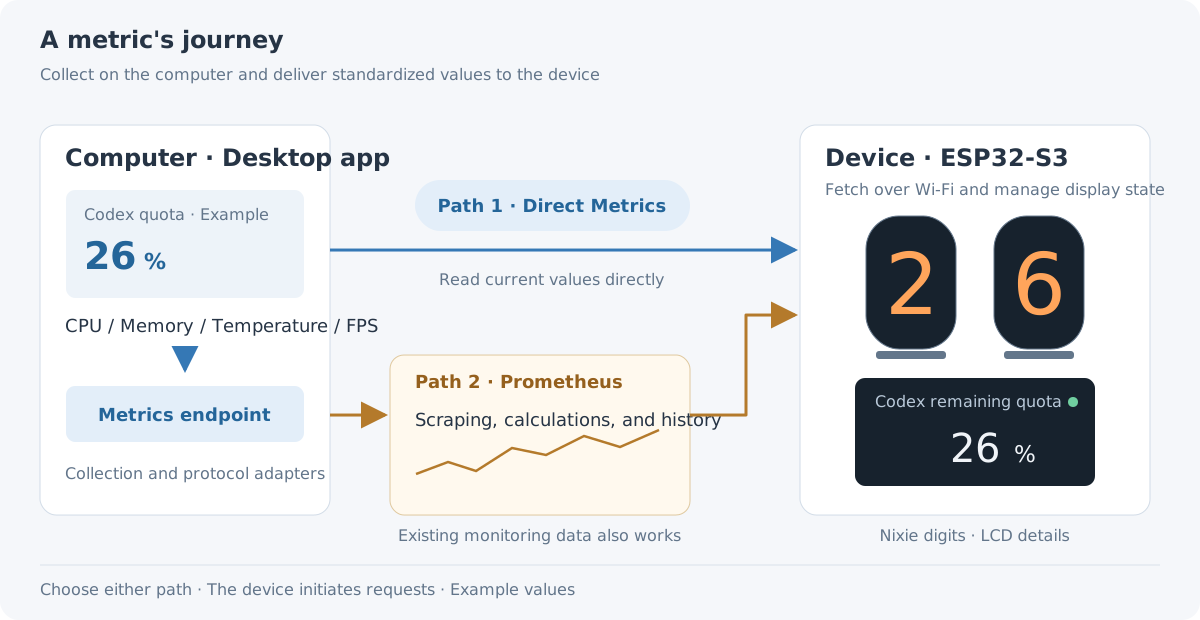
Initially, I wanted the device to speak the ChatGPT desktop application’s native protocol and retrieve quota information itself. For more conventional monitoring, I also wanted Prometheus queries. Once connected to the network, the device could obtain data from either service.
The first attempt proved less convenient than expected. With its default startup configuration, the application only listened on the loopback interface, beyond the reach of an ESP32 on the LAN. The native protocol also introduced long-term uncertainty. Reflashing the device whenever an integration changed would be cumbersome.
I added a desktop companion to decouple collection from display. It calls the application-specific protocol locally, handles connections and queries, and exposes the results as standardized Metrics over the LAN. Native-protocol connections and account-related operations stay on the computer. The ESP32 retrieves configured metrics without understanding each source’s internal protocol.
Changes to an upstream protocol can then be handled in the client’s collector while retaining the metric interface. The device needs no firmware update for those adaptations. CPU load, memory usage, temperature, and game frame rate can use the same path. The device still handles retrieval, validity, and display, with those responsibilities separated from any particular application.
The final design supports two ways to connect.
-
Direct Metrics access. Read values from the desktop companion or another exporter, suitable for displaying current values.
-
Prometheus. Query an existing monitoring service for historical trends and server-side calculations as well as current values.
The desktop companion is one data source, and the device remains a general-purpose metric display. An existing monitoring service can supply it independently. Direct access also works without deploying Prometheus.
Firmware Design and Implementation
Choosing the Framework
As in the hardware work, Codex and I used incremental, spec-driven development. We documented responsibilities, interfaces, and constraints before implementing and validating each stage, and recorded subsequent changes in the design documents. The basic stack consists of the following components.
-
PlatformIO and ESP-IDF organize the project, build firmware, and provide networking and peripheral support.
-
LVGL and esp_lvgl_port handle widgets, menus, and screen updates.
-
esp_lcd and SPI DMA connect rendering to the physical LCD.
-
NVS stores network settings, metric rules, and display preferences. Live values and temporary state stay in memory.
-
Wokwi provides firmware simulation for early display and input checks.
I had mainly used Arduino in earlier projects. AI substantially reduced the work of establishing and maintaining the project framework, making it easier to switch to ESP-IDF and gain finer control over tasks, peripherals, and low-level configuration.
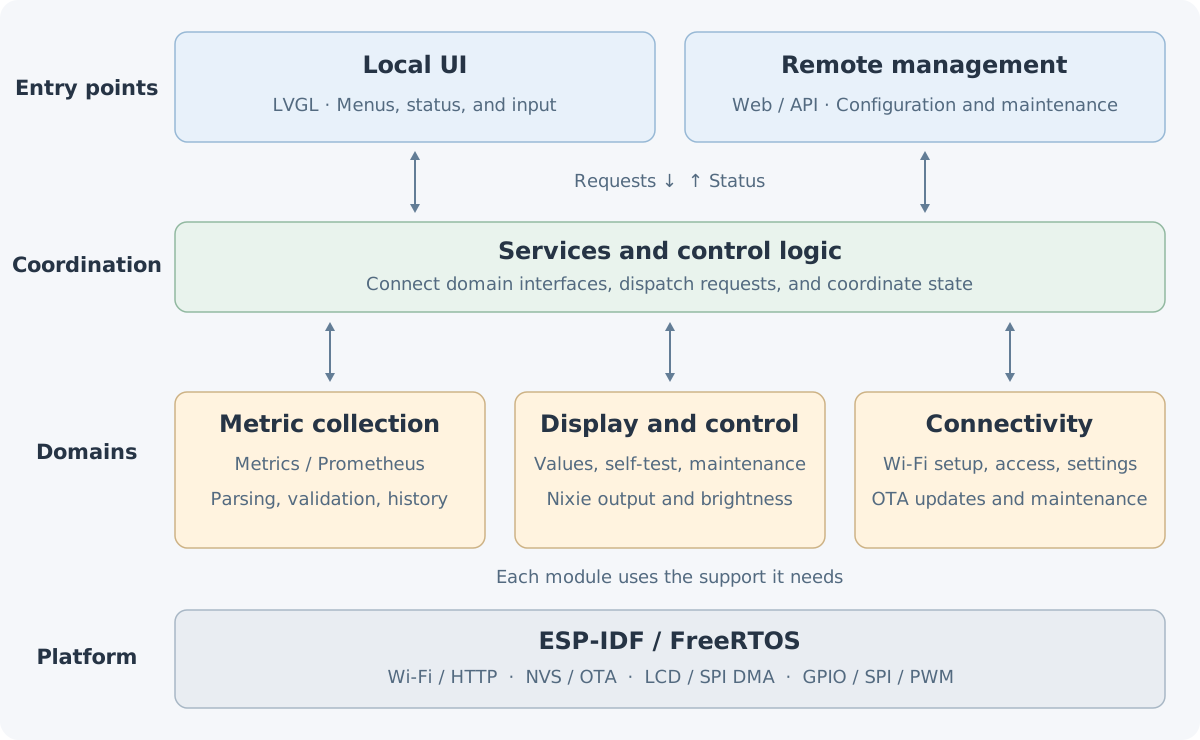
Firmware tasks run on the FreeRTOS integrated into ESP-IDF. I organized the architecture around separate domains, first defining responsibilities, state ownership, and public interfaces, then arranging their interactions.
-
Networking collects data and supports remote access and management.
-
Device control accepts values and requests and determines hardware output centrally.
-
User interaction displays metrics and device state and forwards user actions to the control side.
Explicit interfaces keep changes focused when adding pages or integrating data sources.
I covered the main logic with unit tests, used simulation to check interaction and the data path, and moved to hardware testing once the end-to-end flow broadly worked.
GUI and Menu Interaction
The first firmware design questions concerned the GUI and system menu. What should be visible every day, where should settings live, and how should navigation work? I used LVGL to draw the LCD interface and organized pages around those usage scenarios.
LVGL handles interface composition and rendering. The main metric, trend chart, and system menu are separate views. Menu rows, focus outlines, and status icons reuse common components so that visual changes and interaction feedback remain consistent.
Between the GUI and the screen, esp_lvgl_port and esp_lcd coordinate rendering with SPI DMA pixel transfers. LVGL produces regions to refresh, the driver submits transfers, and completion signals let the interface reuse the buffers. Coordinating drawing and transmission became an important part of the screen implementation.
The knob handles everyday metric selection, brightness adjustment, and self-tests. Requests go through a common control layer, and values retrieved over the network use the same output path.
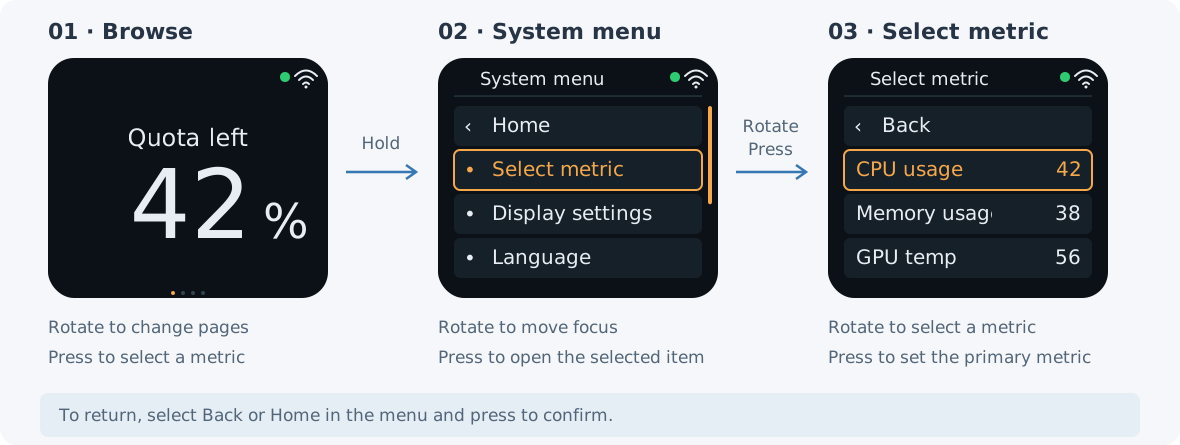
During acceptance checks, I considered whether the interaction matched familiar devices, alongside layout, information hierarchy, and appearance, then refined it through use.
Character coverage and language support
Alongside Chinese and English, we added Japanese and German. An embedded display needs its glyphs packaged in the firmware, so translating strings covers only part of the work. Noto Sans fonts were converted into LVGL font data. Japanese requires the appropriate glyphs, while long German words require layout checks.
Custom metric titles need their own character coverage. We extracted characters from core, general, and industry-specific Chinese and Japanese metric vocabularies, then added letters, numbers, units, and required symbols.
Fonts occupy a substantial share of the firmware, especially when Chinese and Japanese glyphs are combined with multiple sizes. Fixed UI strings use subsets of the characters actually needed. Custom titles draw on the vocabulary lists. Large sizes retain only digits and essential symbols, and some Chinese and Japanese fonts use lossless compression. Character coverage, type size, and readability need to be balanced to leave room for other features and updates.
 The Japanese menu
Controlling the Tubes
Part 1 described the mapping between digits and physical tube pins. Firmware uses that mapping to generate serial data on a dedicated SPI bus, while PWM on BLANK controls brightness. The LCD uses a separate SPI bus so that large screen transfers do not occupy the tube-update bus.
Metric values can remain unchanged for long periods. The firmware therefore cycles through the cathodes once an hour and also provides display rest and a digit-by-digit self-test.
Tube maintenance and cathode poisoning
Each digit is a separate cathode. During discharge, ion bombardment causes sputtering and material loss on the active cathode. Released material can deposit on other cathodes. When only a few digits are used for long periods, deposits on less frequently lit cathodes can interfere with discharge and produce partially unlit digits or incomplete strokes, a condition known as cathode poisoning.
Periodically lighting every digit is a common preventive measure and the reason for the hourly cycling routine.
The tubes show a two-digit integer from 00 to 99. The LCD supplies the complete value, name, unit, and status. Fractional values are converted to integers, and out-of-range values are limited to the two-digit display range. The original value remains on the LCD.
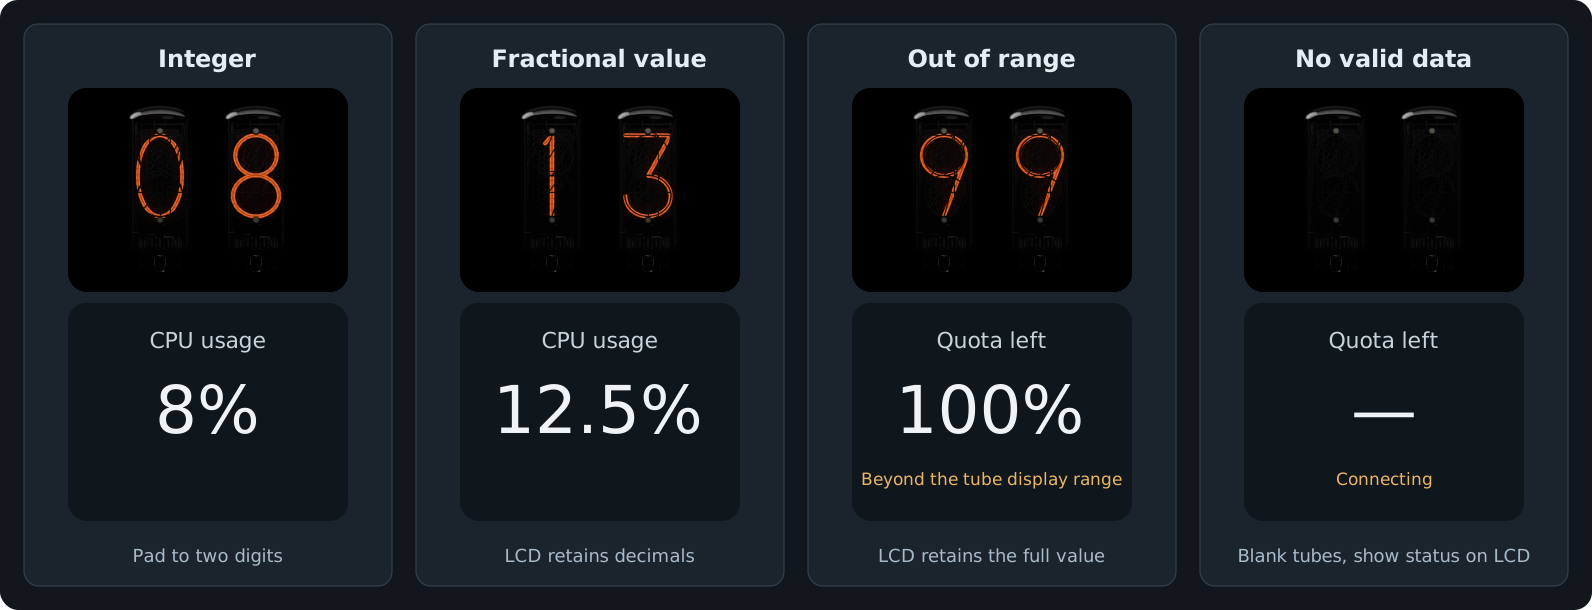
Failure to retrieve data must remain distinct from a zero value. For quota display, a temporarily unreachable service and an exhausted allowance require different states. An old value may be retained within the rule’s allowed interval, but its status must show that it has become stale.
Wi-Fi Setup
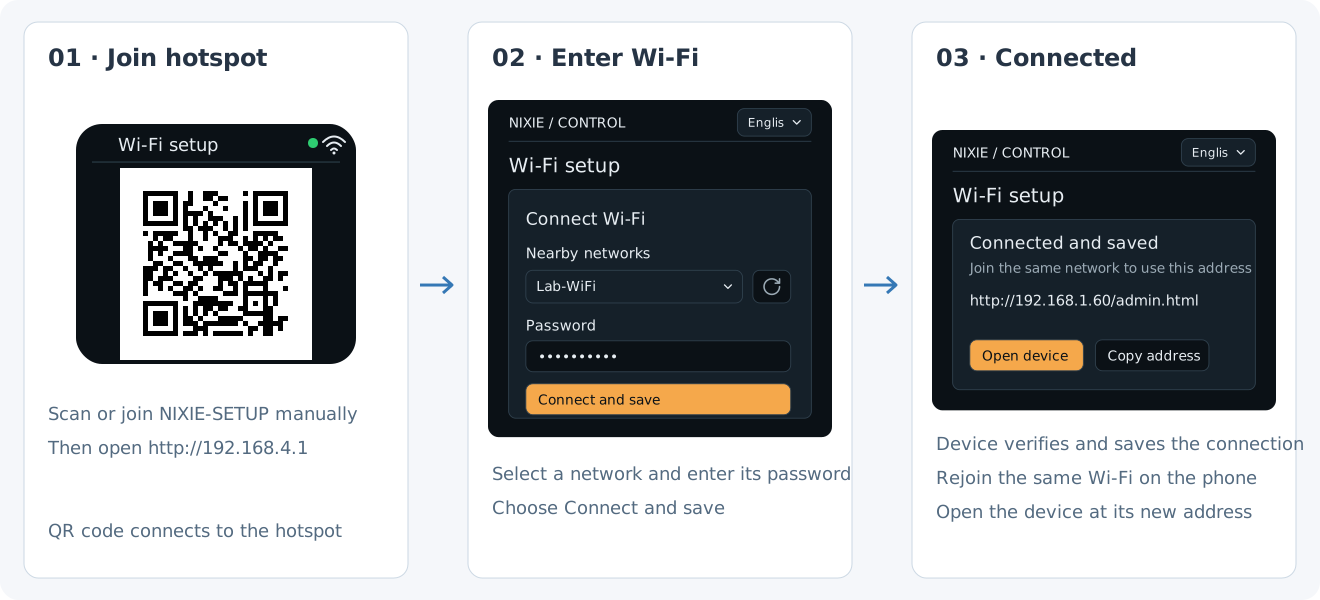
Provisioning uses a conventional SoftAP flow. The device opens a temporary hotspot, a phone connects and submits home Wi-Fi credentials through a web page, and the device joins the target network. The LCD provides the setup entry point and status.
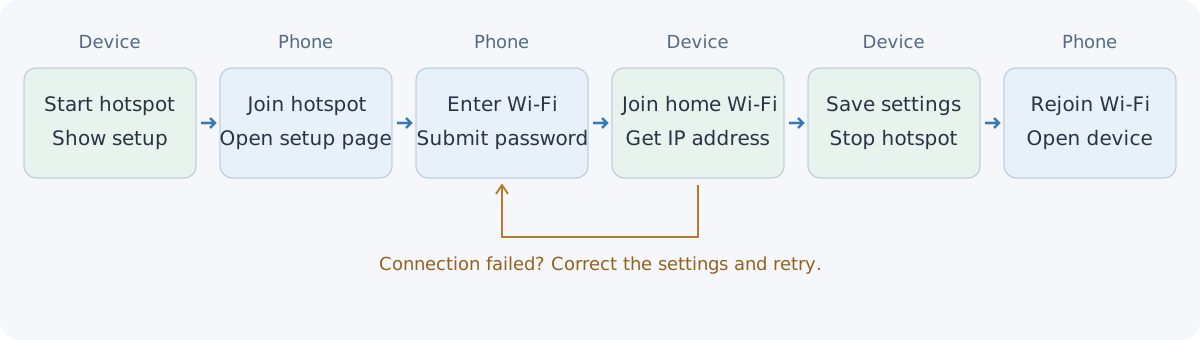
After a successful connection, the device saves the configuration and stops the hotspot. The phone rejoins the same Wi-Fi and opens the management page at the device’s new address. Failed attempts can be retried after correcting the settings. Routine disconnections trigger automatic reconnection, and changing networks starts provisioning again from the menu.
Firmware Updates
With network access available, I included OTA updates so that new firmware could be uploaded through a browser or the desktop app. The current flow selects a local file and uploads it over the LAN. USB flashing remains available for maintenance.
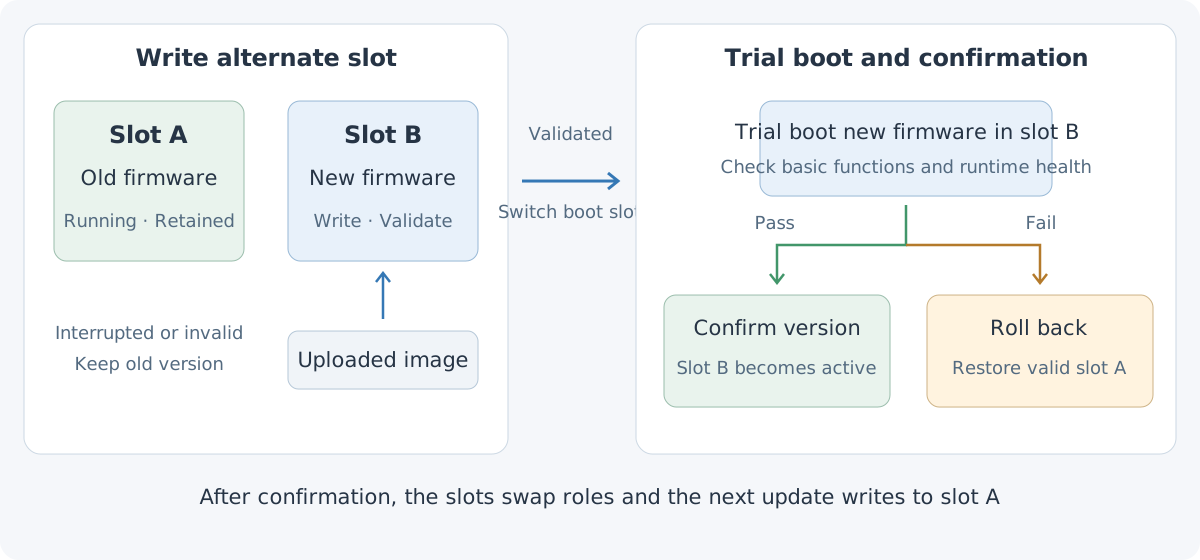
The design uses two application slots in flash. One runs the current firmware and the other receives the new image. The current version stays intact while the alternate slot is written and validated. Only then does the boot target change. An interrupted transfer or failed validation leaves the original version available.
On its first boot, the new firmware checks basic functions such as storage, control tasks, and the GUI before confirming the version. A failed trial boot uses the rollback mechanism to return to the valid older image. After confirmation, the slots exchange roles and the next update writes to the other slot. Reserving room for two images adds a practical constraint to the font-size budget discussed earlier.
Possible OTA extensions
The desktop companion could later check releases, show release notes, and download matching firmware before passing it to the existing upload flow. The device could also fetch firmware from an update service, with signature verification and stable or testing channels. Those remain future extensions. The current focus is LAN updates.
Remote Management and the Desktop Companion
Web Management
Once on the LAN, the device provides a web interface for settings that are awkward to edit on a small screen. Page assets ship with the firmware and are accessible through the device address. A browser authorization request must be approved on the device before management access is granted.
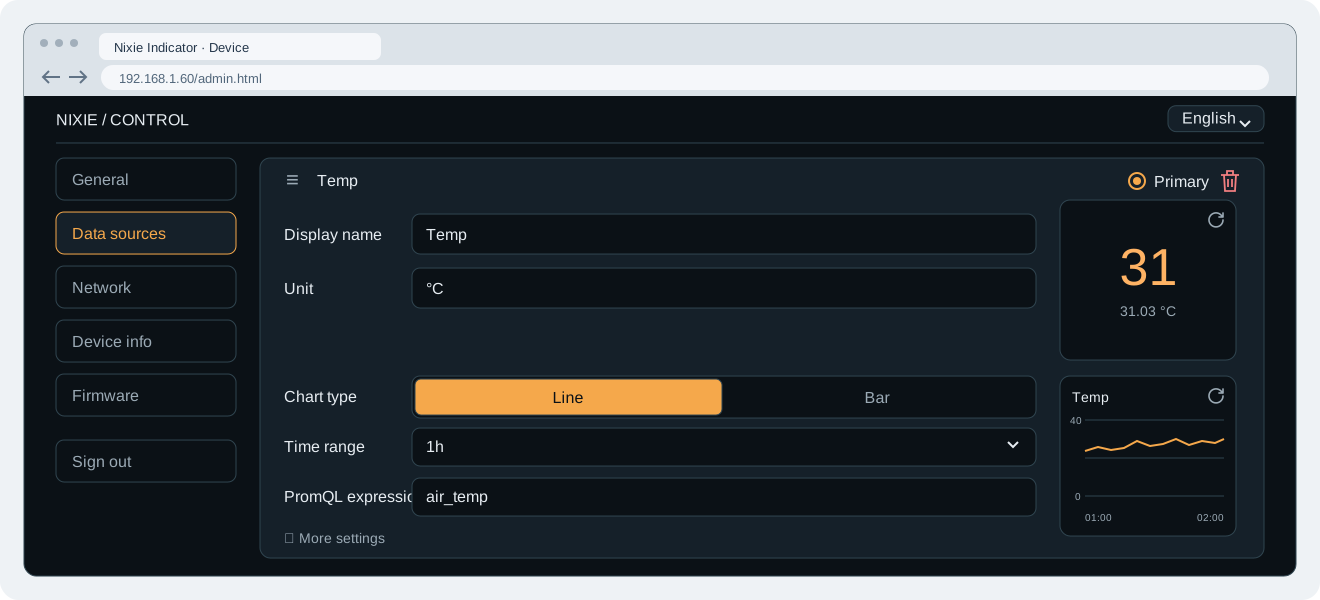
The interface handles display preferences, data sources, firmware uploads, and PromQL configuration with result previews. A common management API carries the requests, while the device owns the configuration rules. The desktop companion reuses that API to keep the two entry points consistent.
The metric page places settings beside the preview. PromQL, display name, unit, and chart style are configured on the left. The current value and historical trend appear on the right. Editing a query and checking its result together makes it easier to verify that the intended information is being collected.
Desktop Implementation
The companion focuses on collector configuration and quick device management, using Tauri 2, Rust, and TypeScript. The UI handles configuration and inspection. A Rust backend collects data, serves Metrics, and connects to the device. Collection runs separately from the window, allowing the tray application to continue working after the window closes.
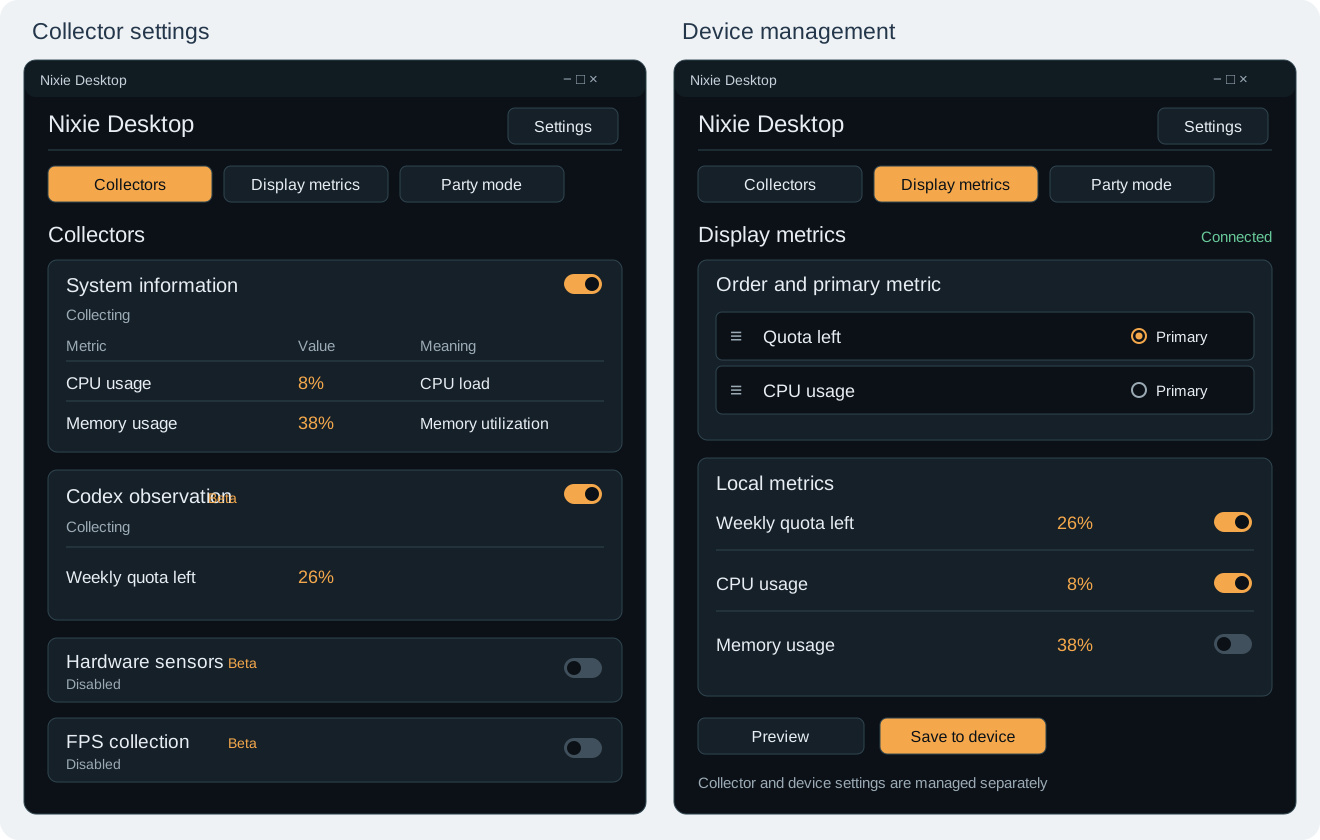
Each source appears as a separate card, with its enable switch, collection state, and current values.
-
System information covers CPU and memory usage.
-
Hardware monitoring covers GPU load, graphics memory, and available temperature sensors.
-
FPS collection follows the foreground application’s frame rate.
-
Codex observation, currently labeled Beta, retrieves local quota information.
Returning to the original purpose, the Codex collector reads the quota on the computer and exports a remaining percentage for the returned quota window. The device consumes an ordinary metric. Application-protocol and account-related handling remain in the client. The displayed value is the remaining proportion of a quota window, rather than an exact token-by-token balance.
After pairing, the app lets me choose metrics from the local results, reorder them, select the primary metric, preview retrieval, and open device settings or firmware updates. Local collection settings and device settings are stored separately, with both available from the client.
Adding data sources
A new source can have an independent collector module that feeds the common scheduler and Metrics endpoint. Protocol adaptations stay within that module while reusing the device’s existing display path.
The device can independently connect to other Metrics services or Prometheus for different hardware and monitoring scenarios.
Party Mode
The tubes can also be a small desktop toy. I added a “party mode” to the companion with simple random-number, countdown, and manual-value controls.
-
Digital dice. Set the range to 1–6 and watch the numbers change rapidly, slow down, and stop on the result. Other ranges work for drawing lots or guessing games.
-
Timed challenges. A glowing countdown adds a little pressure to a board game or short challenge.
-
Score display. Submit a number manually to show the current score.
The modes share the same number-sequence playback capability. The client prepares the numbers and timing, and the device plays them. Leaving party mode restores the regular metric display. The device gains a way for friends to participate beyond simply glancing at a value.

Reflections
Software engineering is a capability LLMs have been improving for years. In this project, AI could handle a fairly complete implementation across the firmware and desktop app. It made me consider where a designer’s attention should go as the cost of writing code falls.
Human involvement increasingly centers on design decisions and engineering standards. The split between client and device, domain boundaries, and ownership of state all affect future maintenance. The DRY principle also matters. Shared business rules need a common implementation so that similar features do not gradually diverge. Naming, interfaces, error handling, and testing need consistent requirements through each iteration and acceptance check.
That is the value of documenting boundaries and agreements first, implementing incrementally, and recording validated changes. As code generation becomes easier, explicit rules become more important for engineering consistency. Adding feature after feature without that discipline can accumulate locally functional implementations and defer the maintenance cost.
Low-level SDK adaptation, toolchain configuration, and environment setup can now also be delegated to the agent. Trying an unfamiliar framework costs less effort, allowing choices to follow the project’s needs more closely. My move from Arduino to ESP-IDF reflects that change. The saved effort can go toward architectural trade-offs, interaction, and acceptance testing, making it more feasible for one person to maintain firmware, a web interface, and a desktop companion together.
The rhythm of hobby development has changed as well. Previously, a project could consume my full attention throughout my spare time, from the idea to detailed implementation. Now I spend more time considering options, expressing requirements, and checking results. While the agent writes code or runs tests, I can watch a video and return when it has something to discuss. The project still needs sustained attention, but using fragments of spare time has become easier.

The companion article covers turning the hardware project into a polished presentation video and producing introduction images.
Last modified on 2026-11-06